| Overall | 11W 7L 2T |
| District | 6W 3L 1T |
| Expected | 13: 1+ 6- |
":" = Games won or lost as expected,
"+" = Games won against stronger team,
"-" = Games lost against weaker team)
|
13 4 3 Rank in State, Class, District |
1237 46 Strength Momentum |
1154 52.9(28) SOS, RPI(RPI Rank) |
":" = Games won or lost as expected, "+" = Games won against stronger team, "-" = Games lost against weaker team) | |
| Date | Opponent1 | RGWF4 | Opp Strength | Result | Expectation2 | Playing Strength | P(Win)3 | Send |
|---|---|---|---|---|---|---|---|---|
| 08/18/15 | at Deming | 0.001 | 831 | W 2- 1 | Expected (-3) | 1094 | 86% |  |
| 08/25/15 | Gadsden | 0.003 | 1154 | T 2- 2 | Worse (-1) | 1186 | 62% | |
| 08/28/15 | at Mayfield ? | 0.006 | 1051 | L 1- 2 | Worse (-3) | 1104 | 68% | |
| 08/29/15 | Las Cruces | 0.007 | 1261 | L 0- 1 | Expected (-1) | 1189 | 50% | |
| 08/29/15 | at Deming | 0.001 | 831 | W 9- 1 | Expected (+4) | 1453 | 86% | |
| 09/01/15 | Hatch | 0.005 | 987 | W 7- 1 | Expected (+3) | 1407 | 79% | |
| 09/03/15 | Onate ?? | 0.016 | 1018 | L 1- 2 | Worse (-3) | 1068 | 75% | |
| 09/08/15 | at Gadsden | 0.030 | 1154 | L 1- 4 | Worse (-4) | 1055 | 58% | |
| 09/12/15 | Silver | 0.006 | 799 | W 10- 0 | Expected (+5) | 1529 | 91% | |
| 09/15/15 | Deming | 0.076 | 831 | W 3- 0 | Expected (-1) | 1175 | 88% | |
| 09/22/15 | Valencia | 0.186 | 1241 | W 2- 0 | Expected (+2) | 1330 | 52% | |
| 09/26/15 | at Centennial | 0.288 | 1281 | L 0- 1 | Expected (0) | 1218 | 44% | |
| 09/29/15 | Santa Teresa | 0.373 | 1197 | T 1- 1 | Worse (-1) | 1208 | 56% | |
| 10/03/15 | Los Lunas ! | 0.417 | 1165 | W 5- 2 | Expected (+2) | 1342 | 60% | |
| 10/06/15 | Belen | 0.560 | 869 | W 4- 2 | Expected (-2) | 1144 | 85% | |
| 10/10/15 | at Valencia | 0.727 | 1241 | L 2- 3 | Expected (-1) | 1199 | 48% | |
| 10/13/15 | Centennial !! | 0.771 | 1281 | W 3- 1 | Better (+2) | 1349 | 48% | |
| 10/17/15 | at Santa Teresa | 0.885 | 1197 | W 1- 0 | Expected (+1) | 1277 | 52% | |
| 10/22/15 | at Los Lunas | 0.983 | 1165 | L 1- 2 | Worse (-2) | 1161 | 56% | |
| 10/24/15 | at Belen | 0.619 | 869 | W 4- 0 | Expected (+1) | 1264 | 83% | |
|
Notes: 1Games against an opponent in the same district are shown in bold letters; may NOT be an actual district game Numbers in parentheses for reported games are the goals Chaparral actually scored, relative to what ratings predicted 2Numbers listed for unreported/future games are the most probable winning margin 3P(Win) is the expected winning Percentage -- the statistical success rate for predicting the game winner between teams of this strength difference 4RGWF is the relative weight factor for this game * Game at a neutral site, or unable to determine which team gets home field advantage |
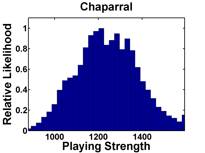
The median opponent strength is 1154, while
Chaparral's "weighted playing strength" is 1240
(where a win by 4 goals counts 0.66 as much as a 1 goal win, and
a game played on 10/03/15 counts 0.5 that of one played on 10/24/15)
Go back to ratings for Boys Varsity Girls Varsity Main Page