| Overall | 14W 6L 0T |
| District | 8W 2L 0T |
| Expected | 13: 0+ 6- |
":" = Games won or lost as expected,
"+" = Games won against stronger team,
"-" = Games lost against weaker team)
|
10 3 1 Rank in State, Class, District |
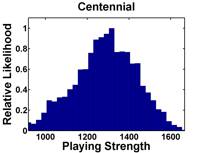
1292 222 Strength Momentum |
1123 54.0(28) SOS, RPI(RPI Rank) |
":" = Games won or lost as expected, "+" = Games won against stronger team, "-" = Games lost against weaker team) | |
| Date | Opponent1 | RGWF4 | Opp Strength | Result | Expectation2 | Playing Strength | P(Win)3 | Send |
|---|---|---|---|---|---|---|---|---|
| 08/18/15 | at Gadsden | 0.001 | 872 | W 3- 0 | Expected (-1) | 1249 | 88% |  |
| 08/25/15 | at Alamogordo ?? | 0.003 | 1003 | L 0- 1 | Worse (-4) | 1114 | 78% | |
| 08/28/15 | Deming | 0.004 | 915 | W 5- 0 | Expected (+1) | 1340 | 90% | |
| 08/29/15 | Onate | 0.007 | 985 | W 1- 0 | Expected (-2) | 1172 | 85% | |
| 08/29/15 | at Mayfield | 0.007 | 1123 | W 1- 0 | Expected (0) | 1274 | 65% | |
| 09/04/15 | Hobbs | 0.019 | 1197 | L 0- 1 | Worse (-2) | 1178 | 65% | |
| 09/08/15 | Deming | 0.019 | 915 | W 6- 0 | Expected (+2) | 1392 | 90% | |
| 09/10/15 | at Aztec ? | 0.025 | 1158 | L 0- 6 | Worse (-7) | 937 | 61% | |
| 09/11/15 | at Carlsbad | 0.055 | 1178 | L 1- 2 | Worse (-2) | 1201 | 59% | |
| 09/12/15 | Mayfield | 0.062 | 1123 | W 2- 1 | Expected (-1) | 1242 | 72% | |
| 09/22/15 | Los Lunas | 0.149 | 1217 | L 1- 4 | Worse (-4) | 1088 | 62% | |
| 09/26/15 | at Chaparral | 0.143 | 1082 | W 5- 0 | Expected (+3) | 1455 | 70% | |
| 09/29/15 | Valencia | 0.359 | 1206 | W 2- 0 | Expected (+1) | 1333 | 63% | |
| 10/03/15 | at Belen ! | 0.429 | 1170 | W 3- 1 | Expected (+1) | 1347 | 60% | |
| 10/06/15 | Santa Teresa | 0.599 | 1080 | W 3- 2 | Expected (-1) | 1220 | 76% | |
| 10/10/15 | at Los Lunas !! | 0.547 | 1217 | W 4- 1 | Expected (+3) | 1421 | 55% | |
| 10/13/15 | Chaparral | 0.431 | 1082 | W 6- 0 | Expected (+4) | 1475 | 76% | |
| 10/17/15 | at Valencia | 0.923 | 1206 | L 2- 3 | Worse (-2) | 1215 | 56% | |
| 10/20/15 | Belen | 1170 | F 1--1 | Forfeit +2 | --- | 67% | | |
| 10/24/15 | at Santa Teresa | 0.857 | 1080 | W 2- 0 | Expected (0) | 1302 | 69% | |
|
Notes: 1Games against an opponent in the same district are shown in bold letters; may NOT be an actual district game Numbers in parentheses for reported games are the goals Centennial actually scored, relative to what ratings predicted 2Numbers listed for unreported/future games are the most probable winning margin 3P(Win) is the expected winning Percentage -- the statistical success rate for predicting the game winner between teams of this strength difference 4RGWF is the relative weight factor for this game * Game at a neutral site, or unable to determine which team gets home field advantage |
The median opponent strength is 1123, while
Centennial's "weighted playing strength" is 1304
(where a win by 4 goals counts 0.70 as much as a 1 goal win, and
a game played on 10/03/15 counts 0.5 that of one played on 10/24/15)
Go back to ratings for Boys Varsity Girls Varsity Main Page